UIDebuggingInformationOverlay
Update, December 9, 2017: This overlay still exists, but this post’s instructions don’t work on iOS 11 and later. In an update to his excellent book, Advanced Apple Debugging and Reverse Engineering, Derek Selander describes how to get the panel working in iOS 11. He’s generously posted the chapter for free here.
While browsing UIKit’s private headers recently, I came across a class that I hadn’t seen before - UIDebuggingInformationOverlay. A Google search didn’t turn up much info, so figured I’d write a short description of what I’ve found.
UIDebuggingInformationOverlay is a private UIWindow subclass created by Apple, presumably to help developers and designers debug Apple’s own iOS apps.
When enabled, the window floats over your app’s content, like so:
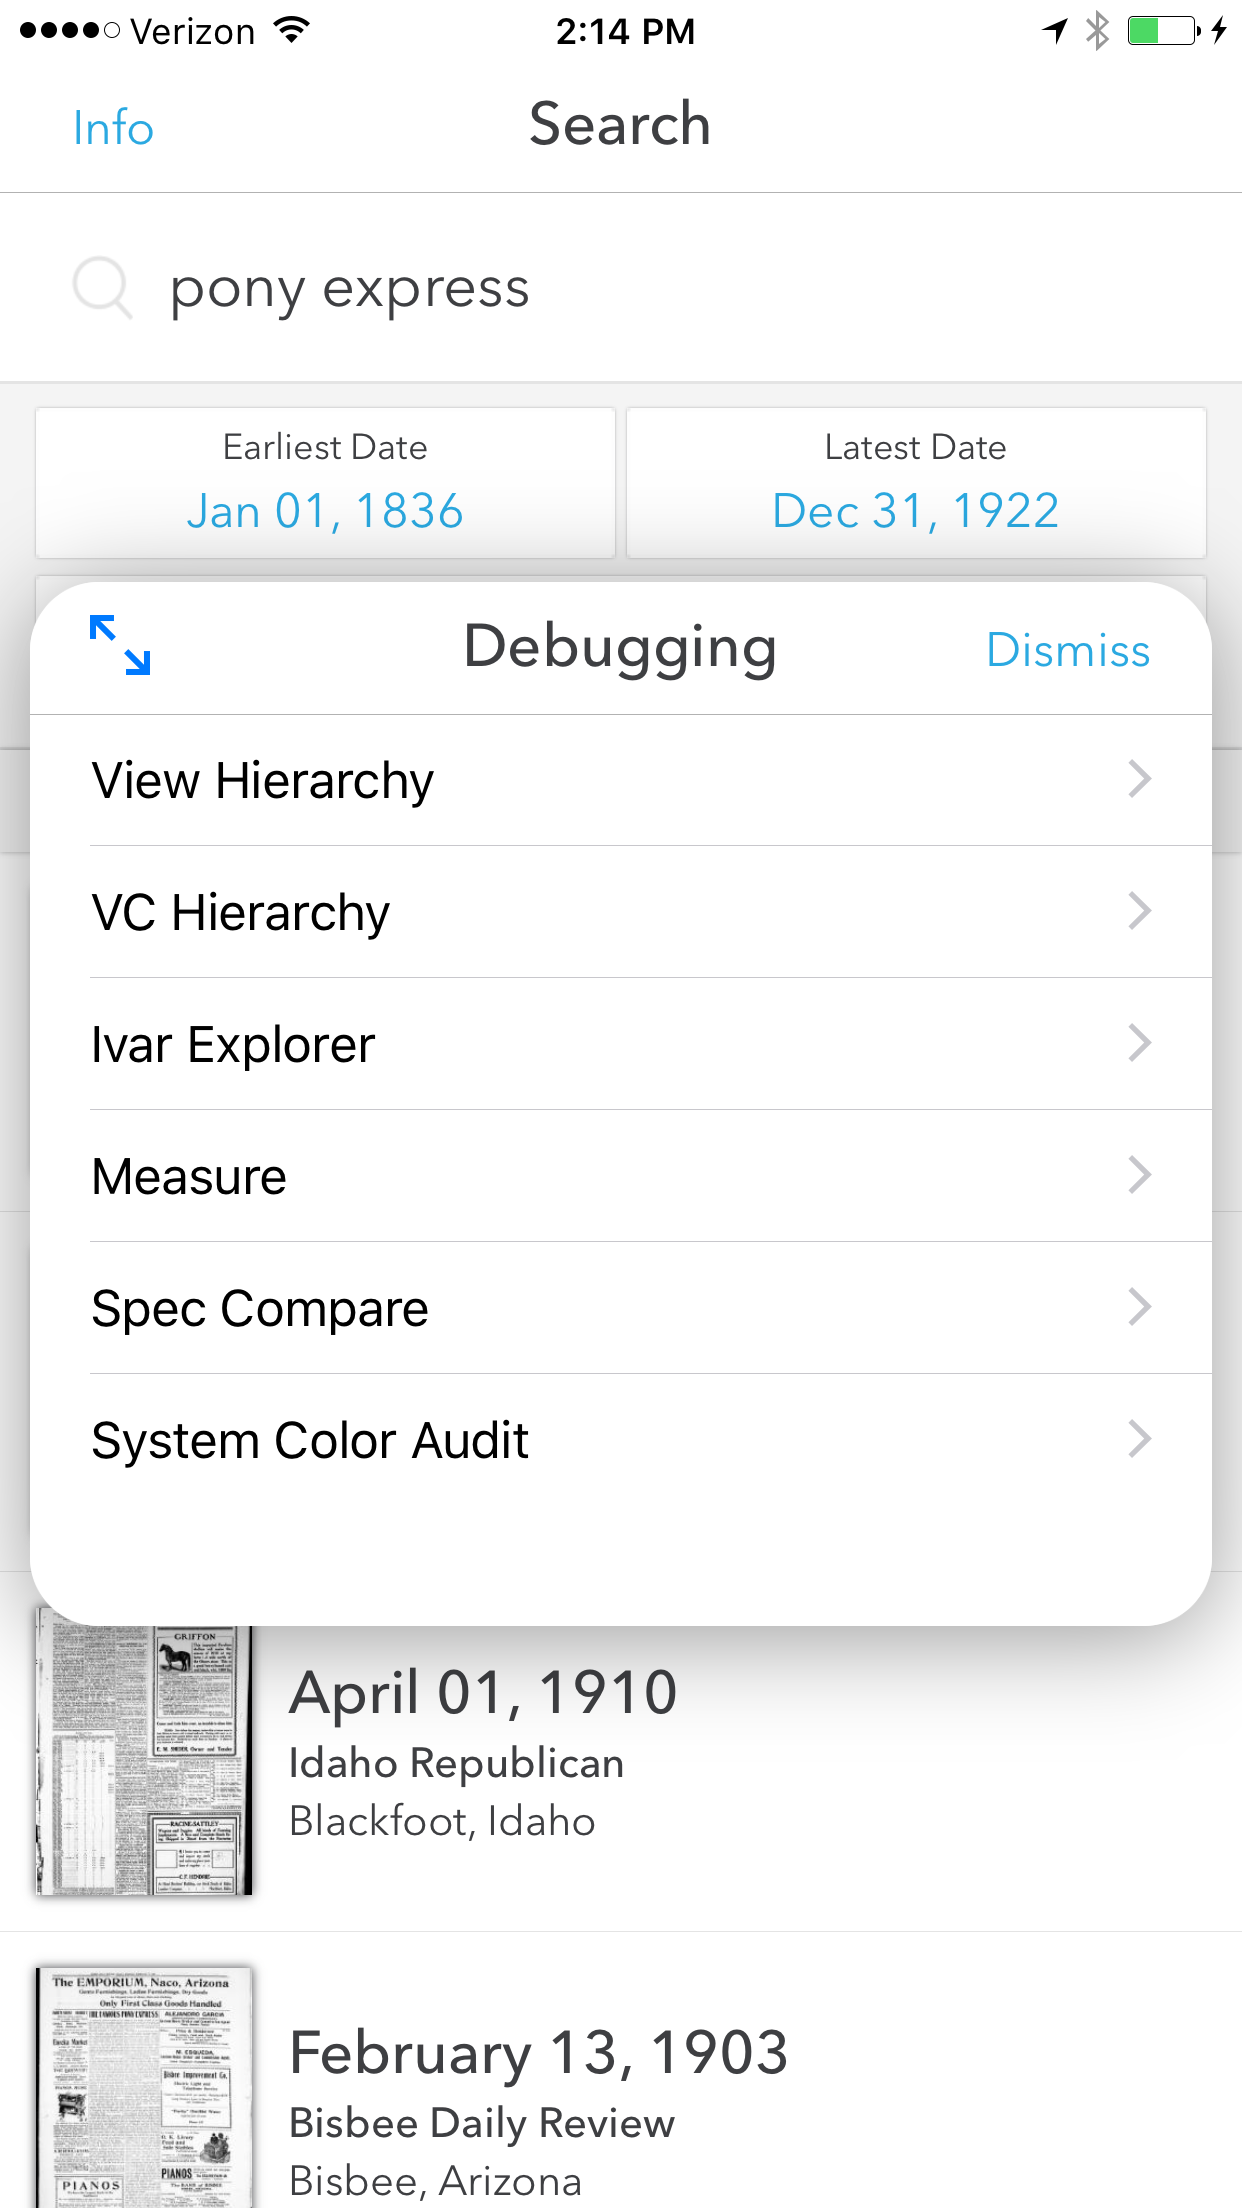
In this post, I’ll show you how to make it display. I’ll also summarize its features, at least as I understand them.
How to show UIDebuggingInformationOverlay
There are two steps needed to show UIDebuggingInformationOverlay in all its glory:
- Call
[UIDebuggingInformationOverlay prepareDebuggingOverlay]- I’m not sure exactly what this method does, but the overlay will be empty if you don’t call it. - Call
[[UIDebuggingInformationOverlay overlay] toggleVisibility]- This shows the overlay window (assuming it’s not already visible).
Because the class and its methods are private, you’ll need to jump through a few hoops to get the code to compile. One approach is to use the global ‘NSClassFromString’ and ‘NSSelectorFromString’ functions. In Swift, this approach looks something like:
let overlayClass = NSClassFromString("UIDebuggingInformationOverlay") as? UIWindow.Type
_ = overlayClass?.perform(NSSelectorFromString("prepareDebuggingOverlay"))
let overlay = overlayClass?.perform(NSSelectorFromString("overlay")).takeUnretainedValue() as? UIWindow
_ = overlay?.perform(NSSelectorFromString("toggleVisibility"))
However you choose to do it, be sure that the code doesn’t make it into your App Store build, else you’re likely to get rejected.
Update, May 26, 2017: Thanks to Bryce Pauken, who discovered that once you’ve called [UIDebuggingInformationOverlay prepareDebuggingOverlay], you can just tap the status bar with two fingers to show the console. No need to call toggleVisibility.
Update, June 2, 2017: More from Bryce:
I went through a disassembler (Hopper!) because I was curious about what prepareDebuggingOverlay did as well. Here’s part of the output. Even before parsing through it, statusBarWindow + numberOfTouchesRequired jumps out quickly enough:
r14 = [[*_UIApp statusBarWindow] retain];
r15 = [UITapGestureRecognizer alloc];
rbx = [[UIDebuggingInformationOverlay overlay] retain];
r12 = [r15 initWithTarget:rbx action:@selector(_handleActivationGesture:)];
[rbx release];
[r12 setNumberOfTouchesRequired:0x2];
[r12 setNumberOfTapsRequired:0x1];
[r14 addGestureRecognizer:r12];
Another fun takeaway from Hopper — there actually is a spot in UIKit where this method is called: (
-[UIApplication _runWithMainScene:transitionContext:completion:], seems to be called during app launch) which after some more digging, seems to enable the debug overlay if 1)CPIsInternalDevice()returns true, and 2)UserDefaults(suiteName: "com.apple.UIKit")has a value of true for “DebuggingOverlayEnabled”. No information there that makes this nicer to enable, but still fun food for thought :)
What UIDebuggingInformationOverlay can do
As you can see from the above screenshot, the overlay provides seven features. I’ll give a brief overview of the first six. I wasn’t able to get the ‘System Color Audit’ screen to show me anything, send me a message if you have better luck.
The 'View Hierarchy' screen
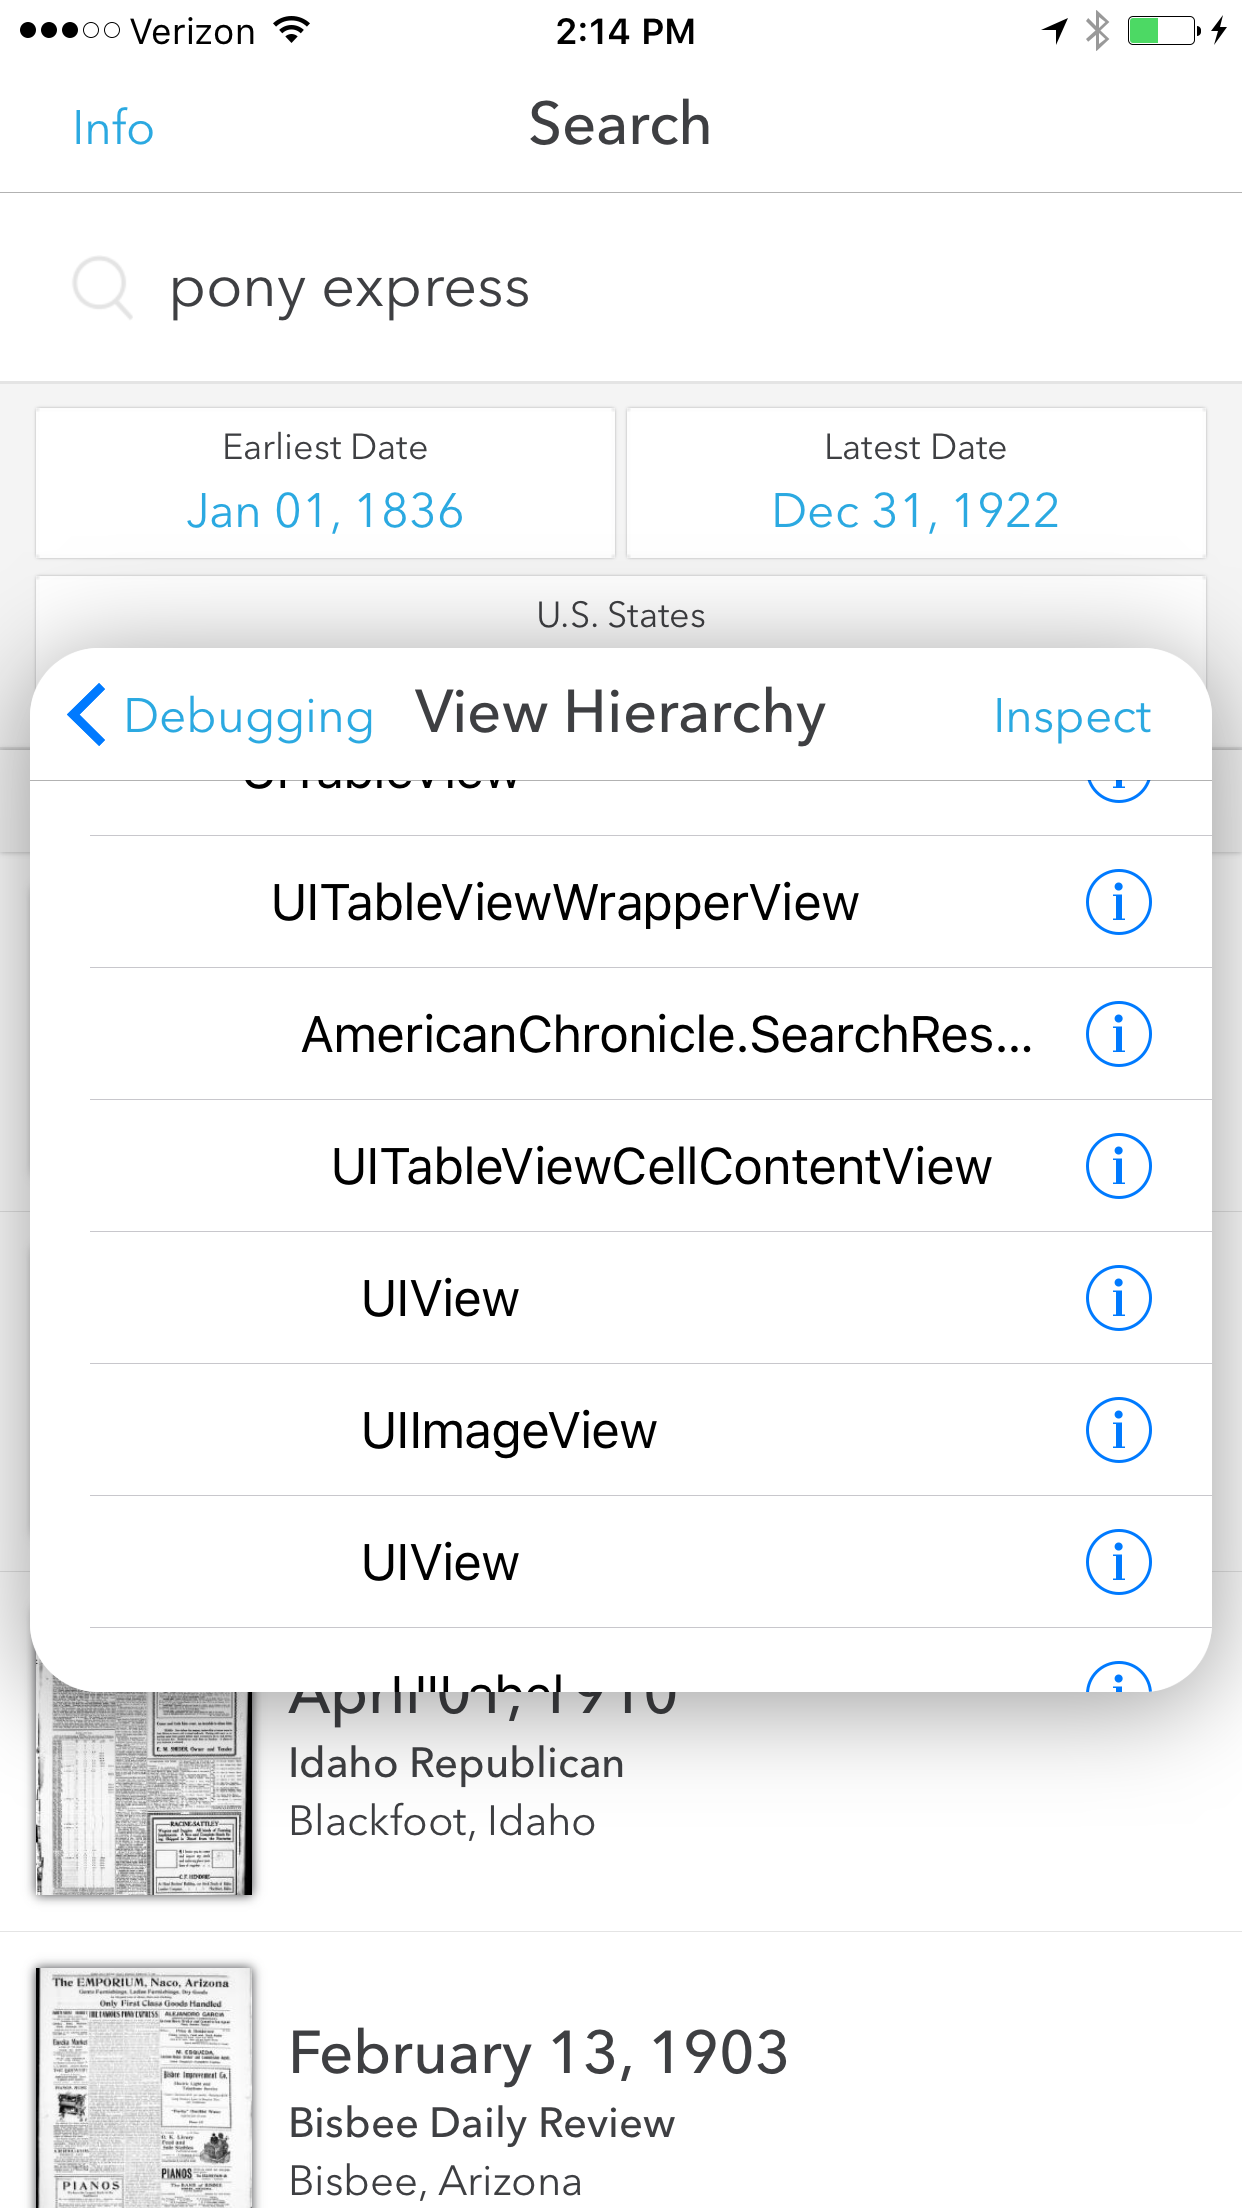
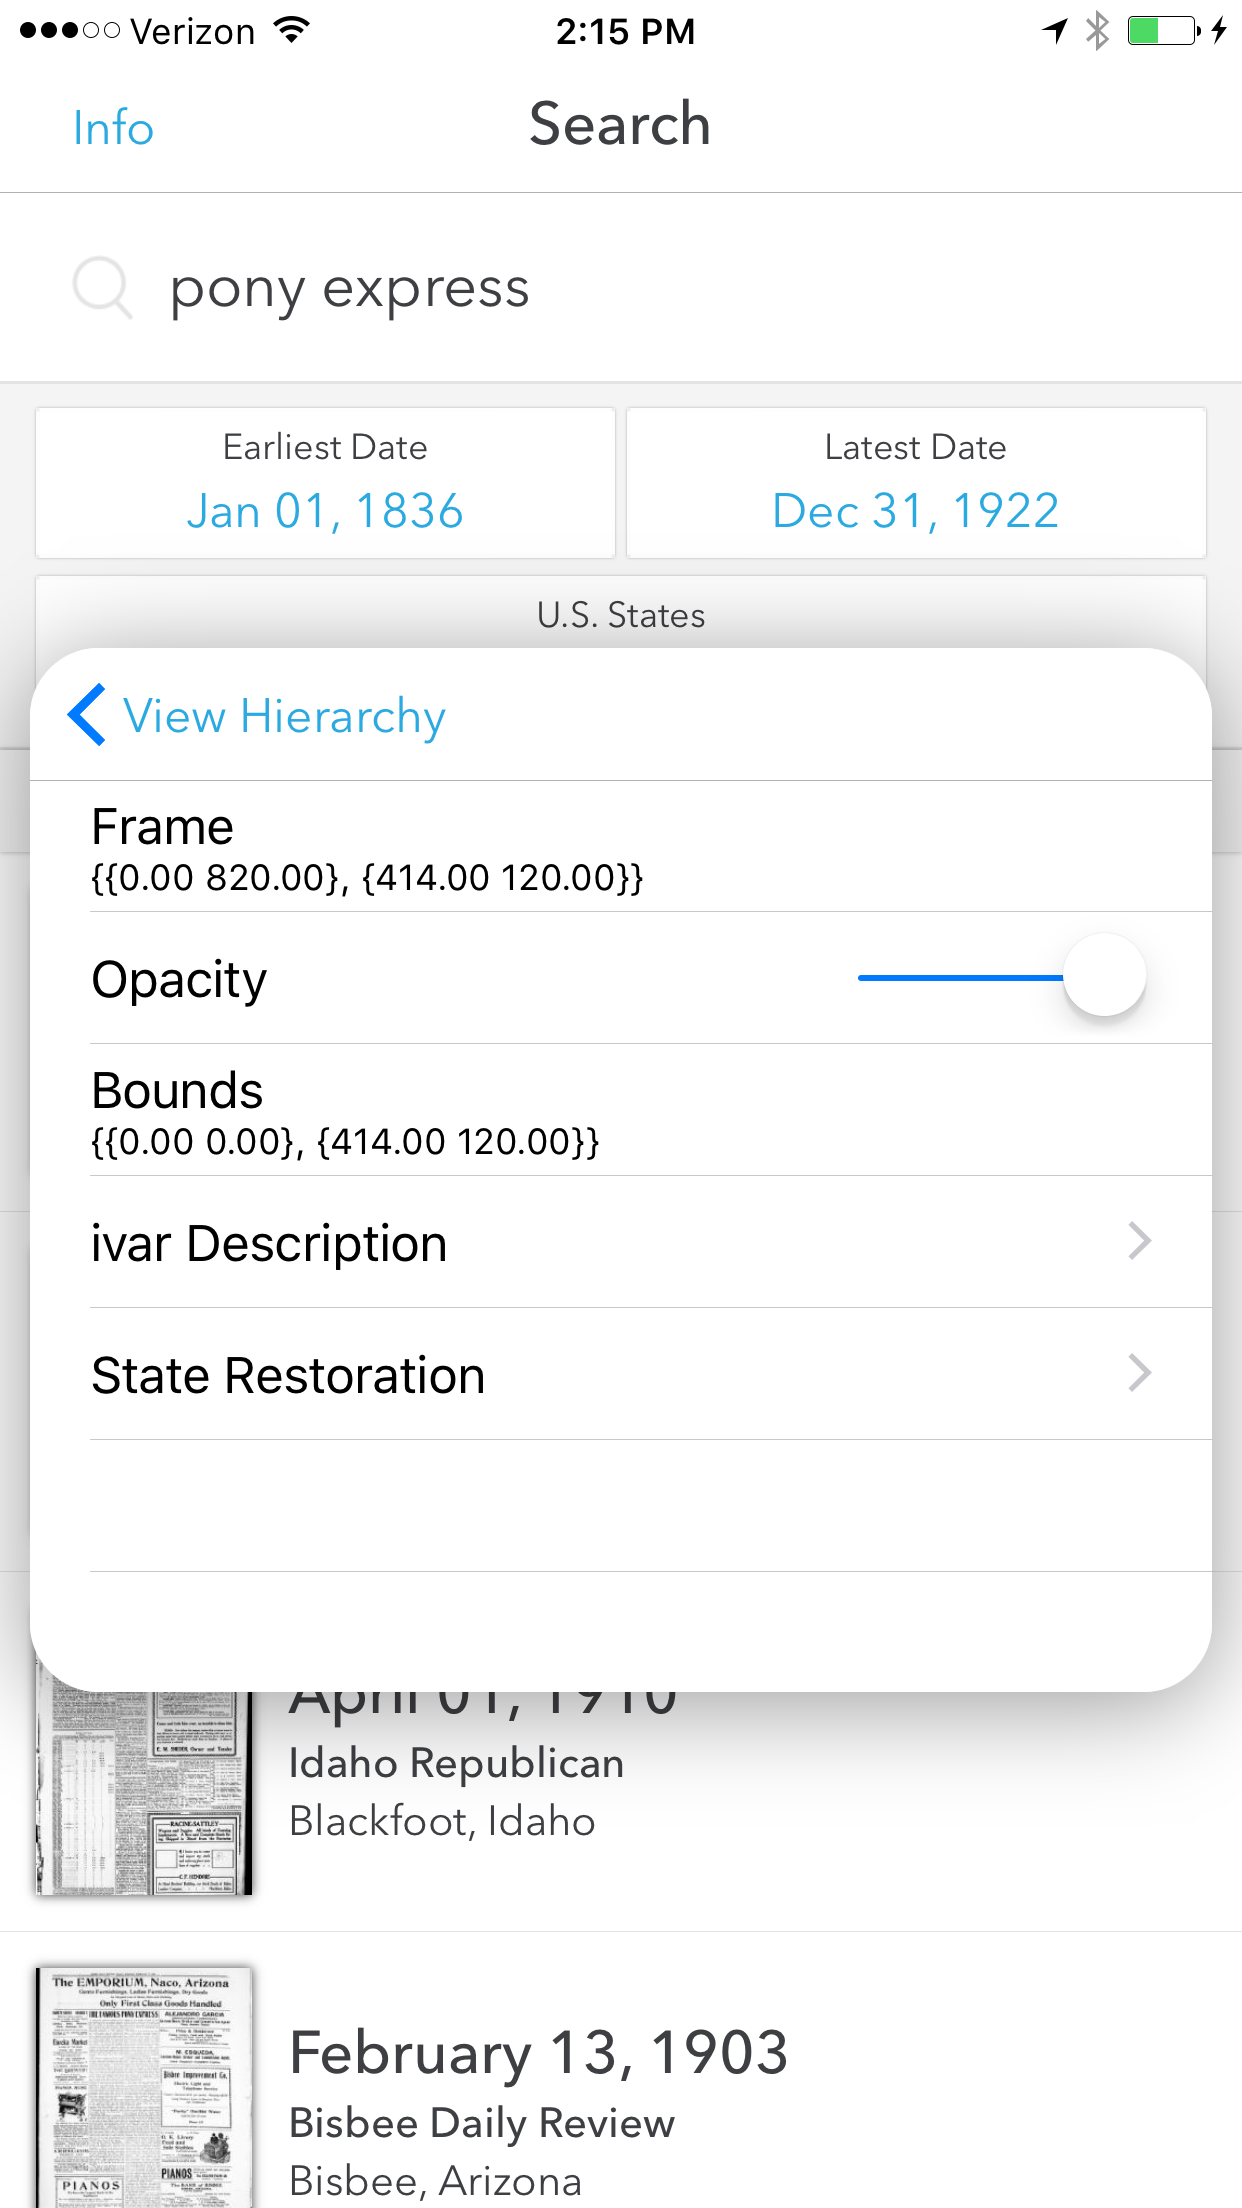
This screen shows what you’d probably expect; a list of views in the selected window. From here, you can inspect any view’s details, including its frame and instance variables. You can also switch between windows if you have more than one, or are just curious to see how a system window is built.
The 'VC Hierarchy' screen
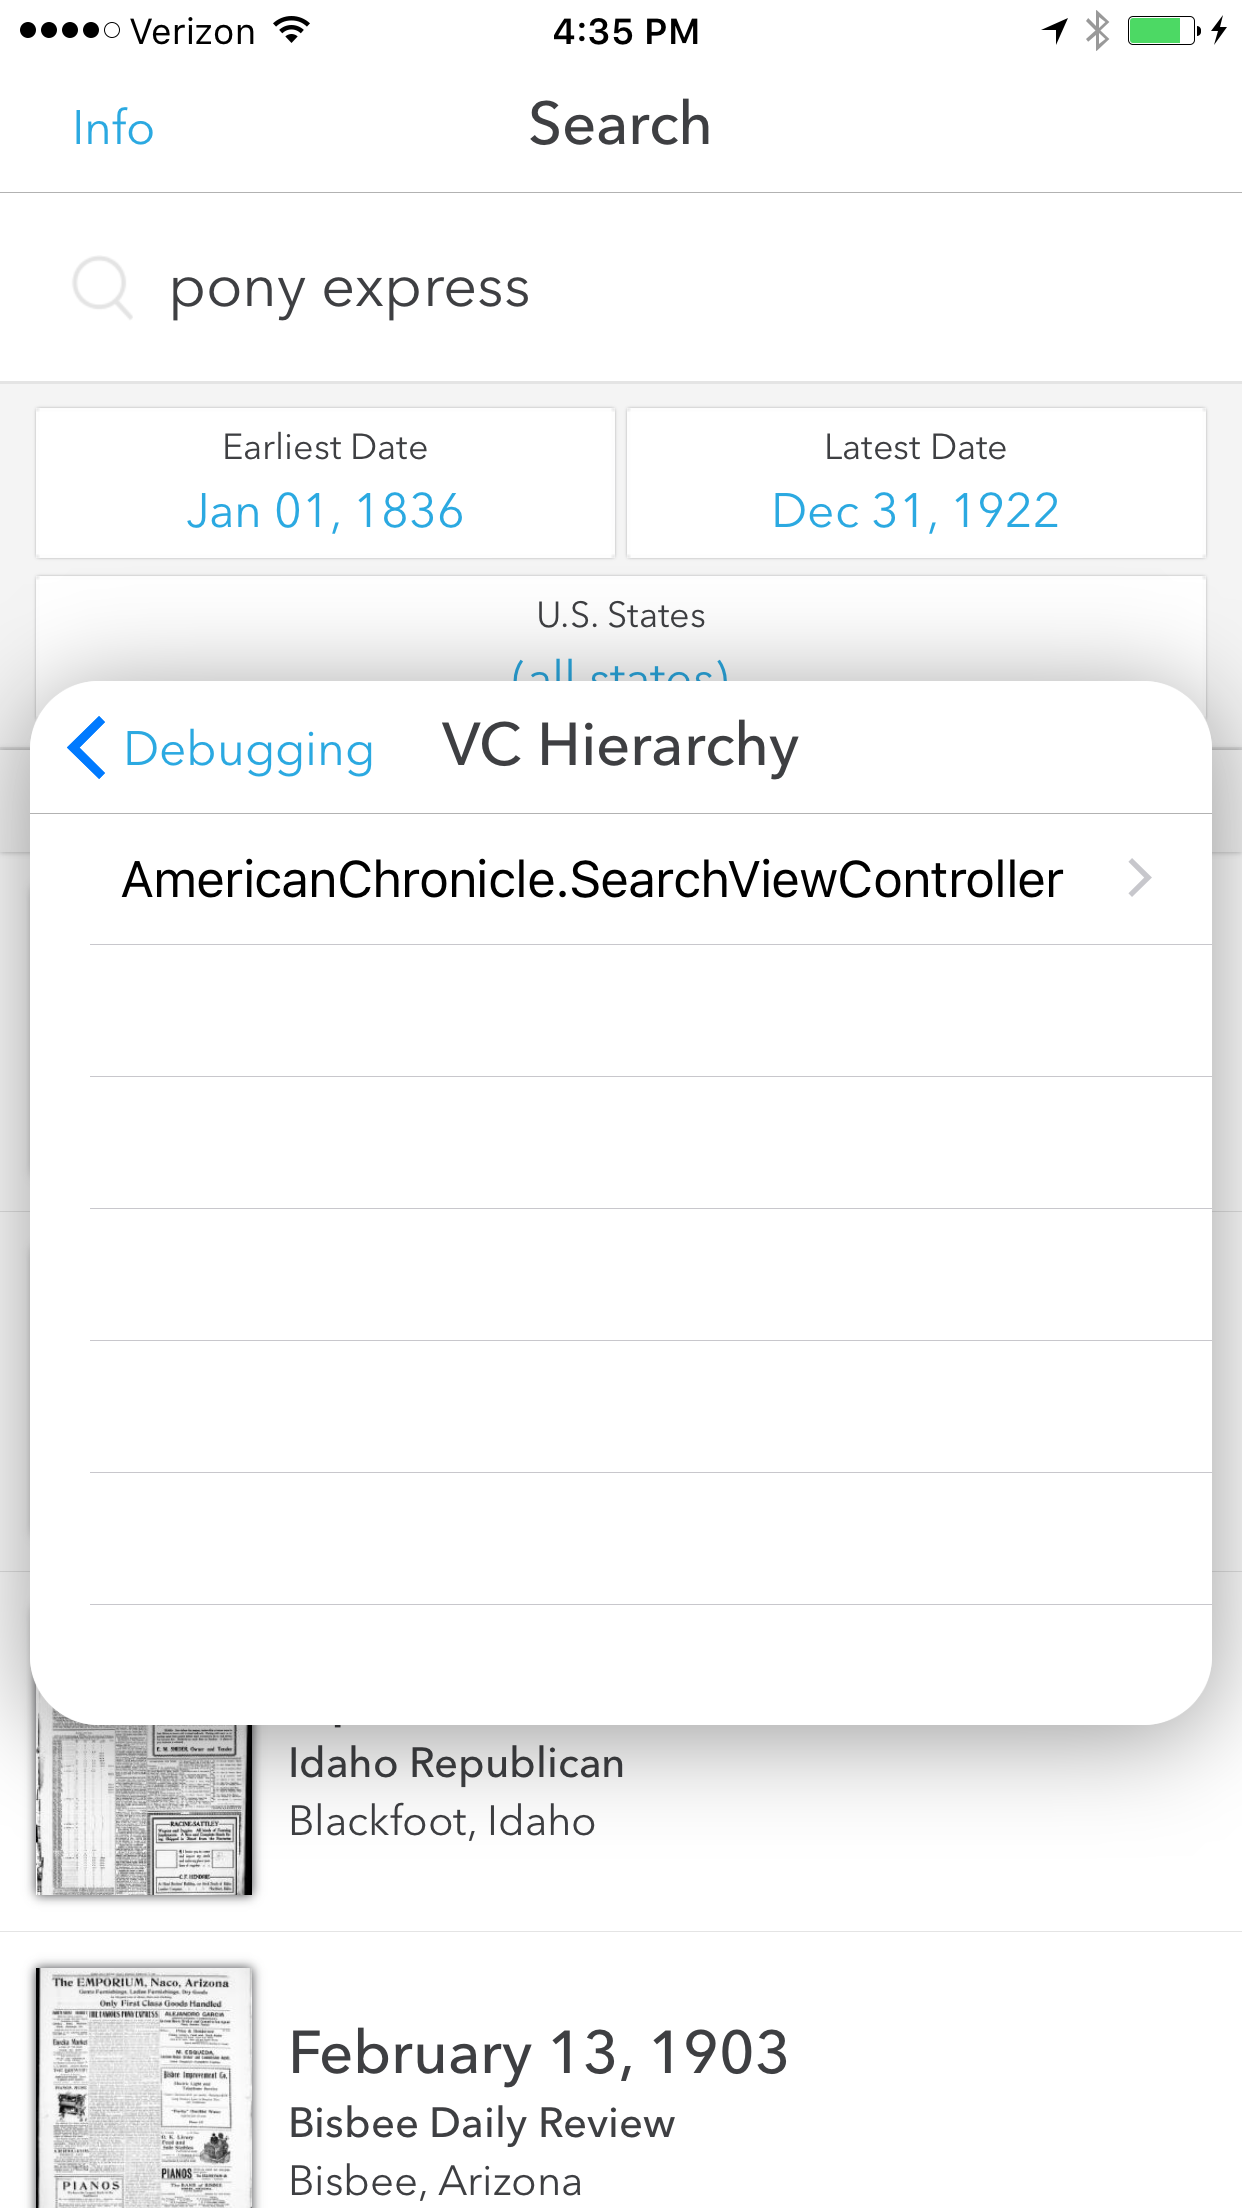
You can probably predict what this screen does as well. It’s very similar to the ‘View Hierarchy’ screen, except that it shows the hierarchy of active view controllers. From here, you can inspect any view controller’s details, including its view. You can also see whether the view controller is presenting a modal or is itself being presented.
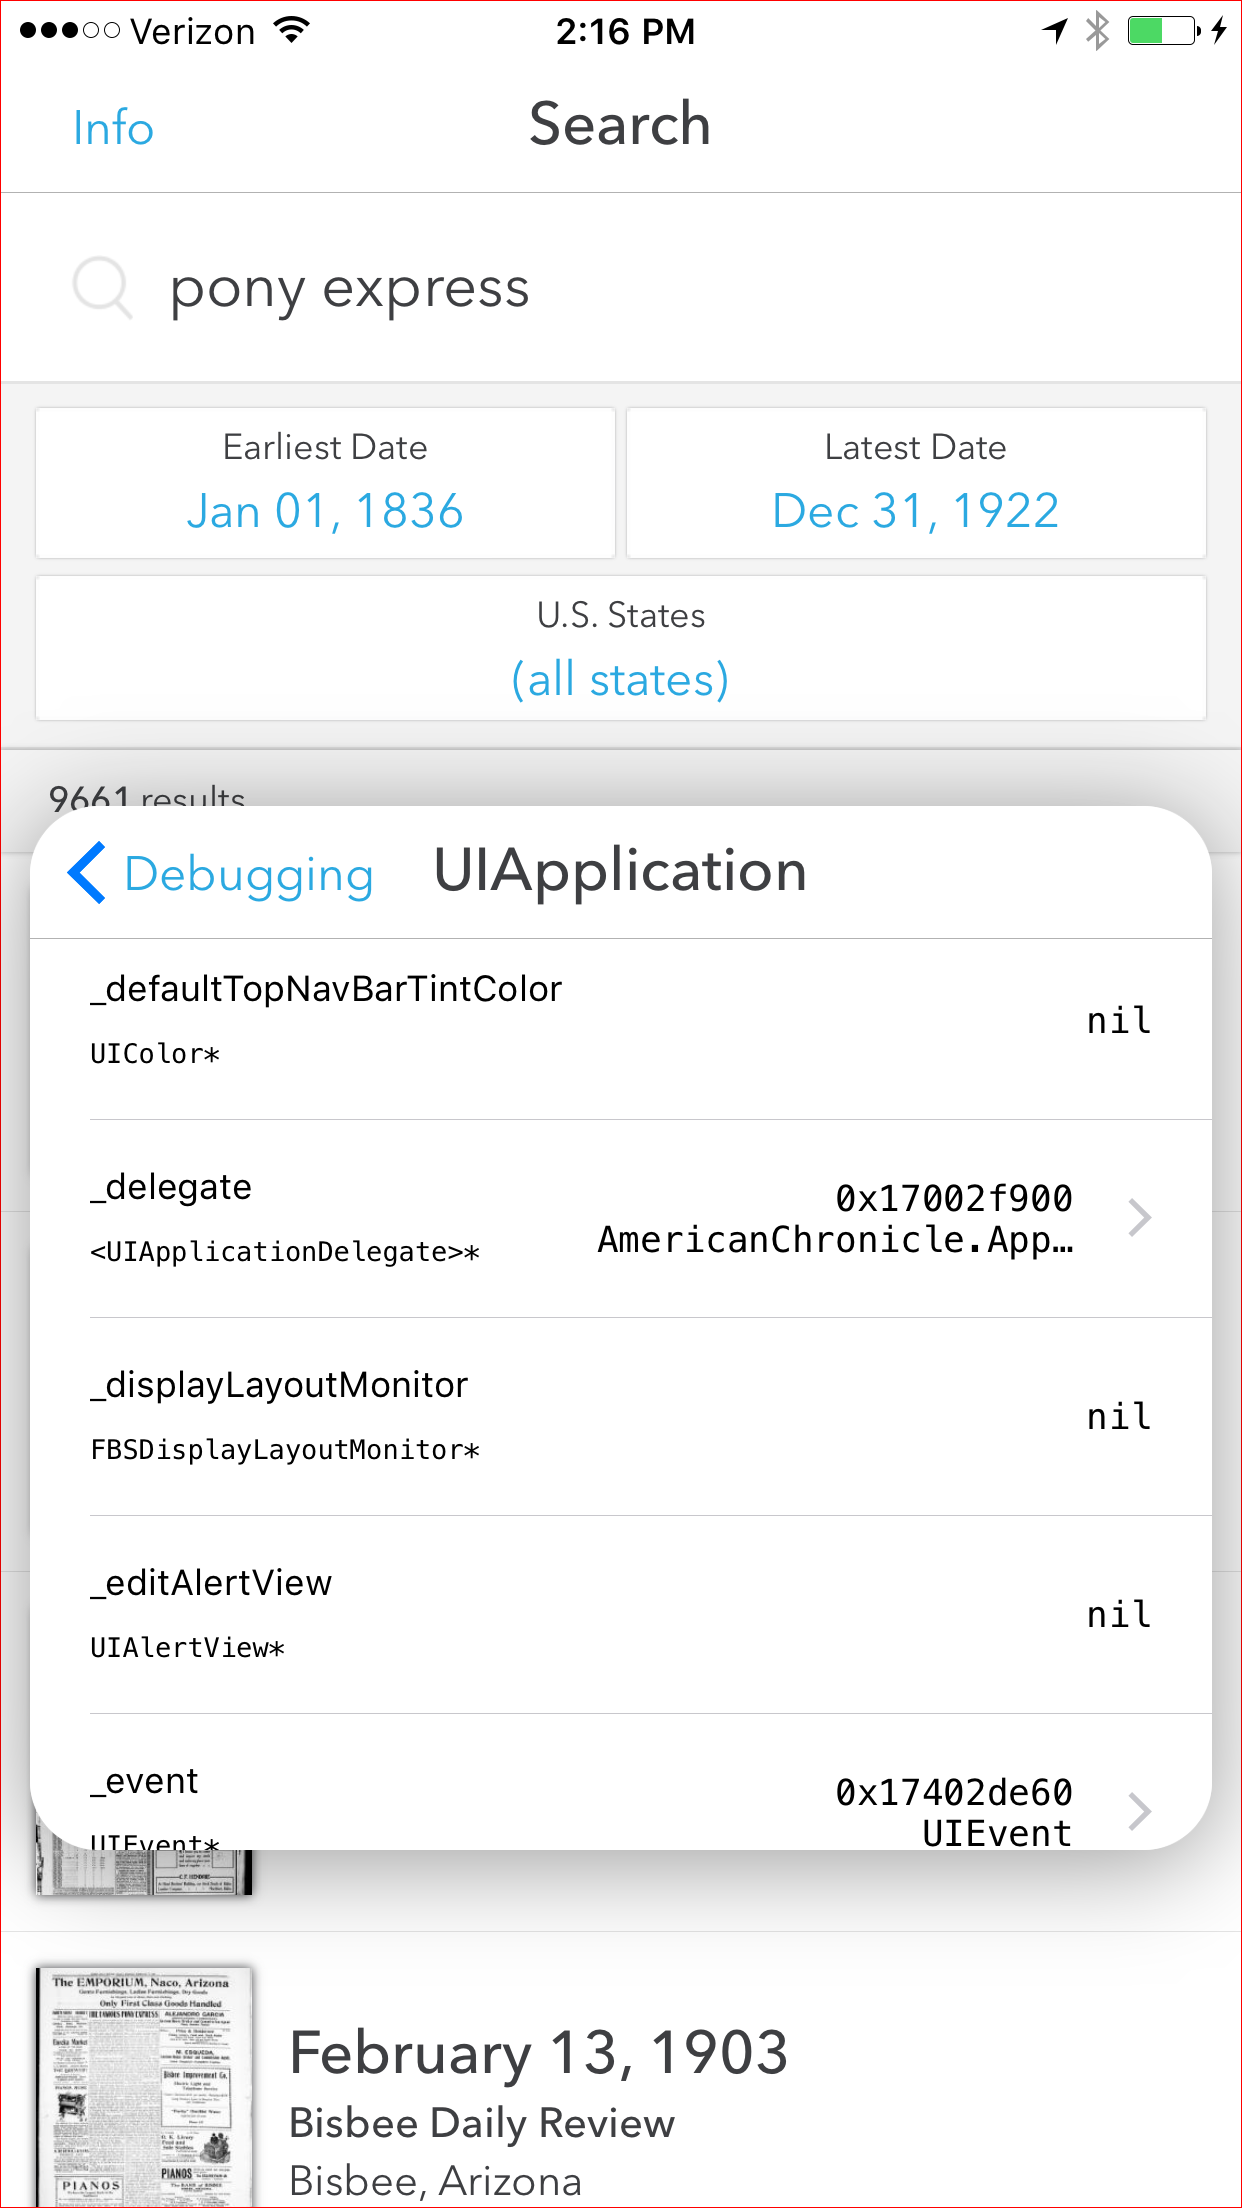
The 'Ivar Explorer' screen
This screen gives you access to the UIApplication instance’s variables. More importantly, any object variables can also be explored. This includes the app delegate which, depending on your app’s structure, might provide a handy entry point into your custom objects.
The 'Measure' screen
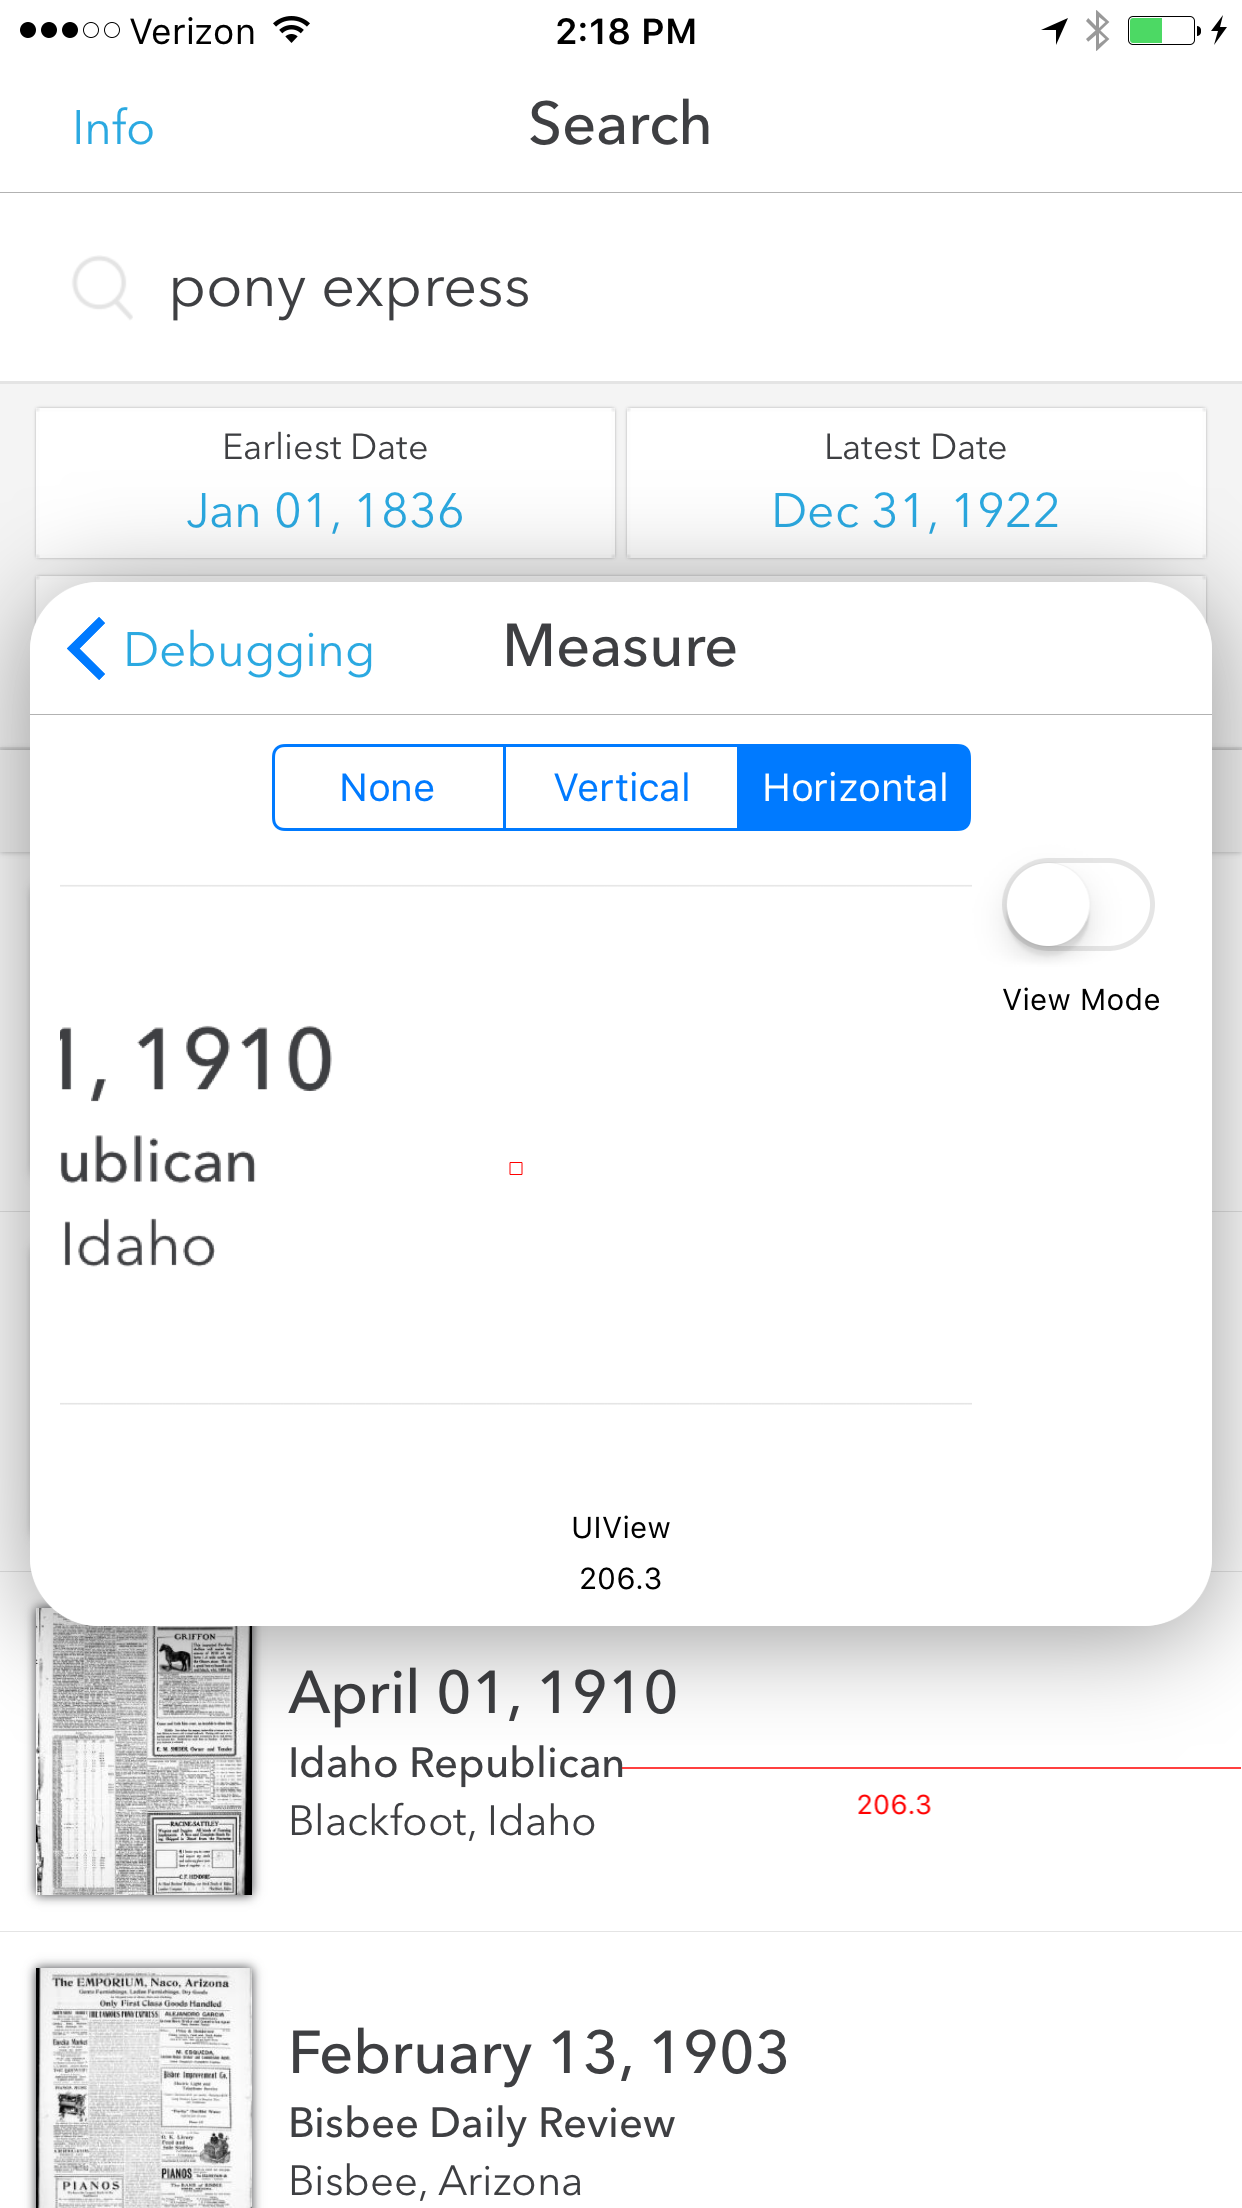
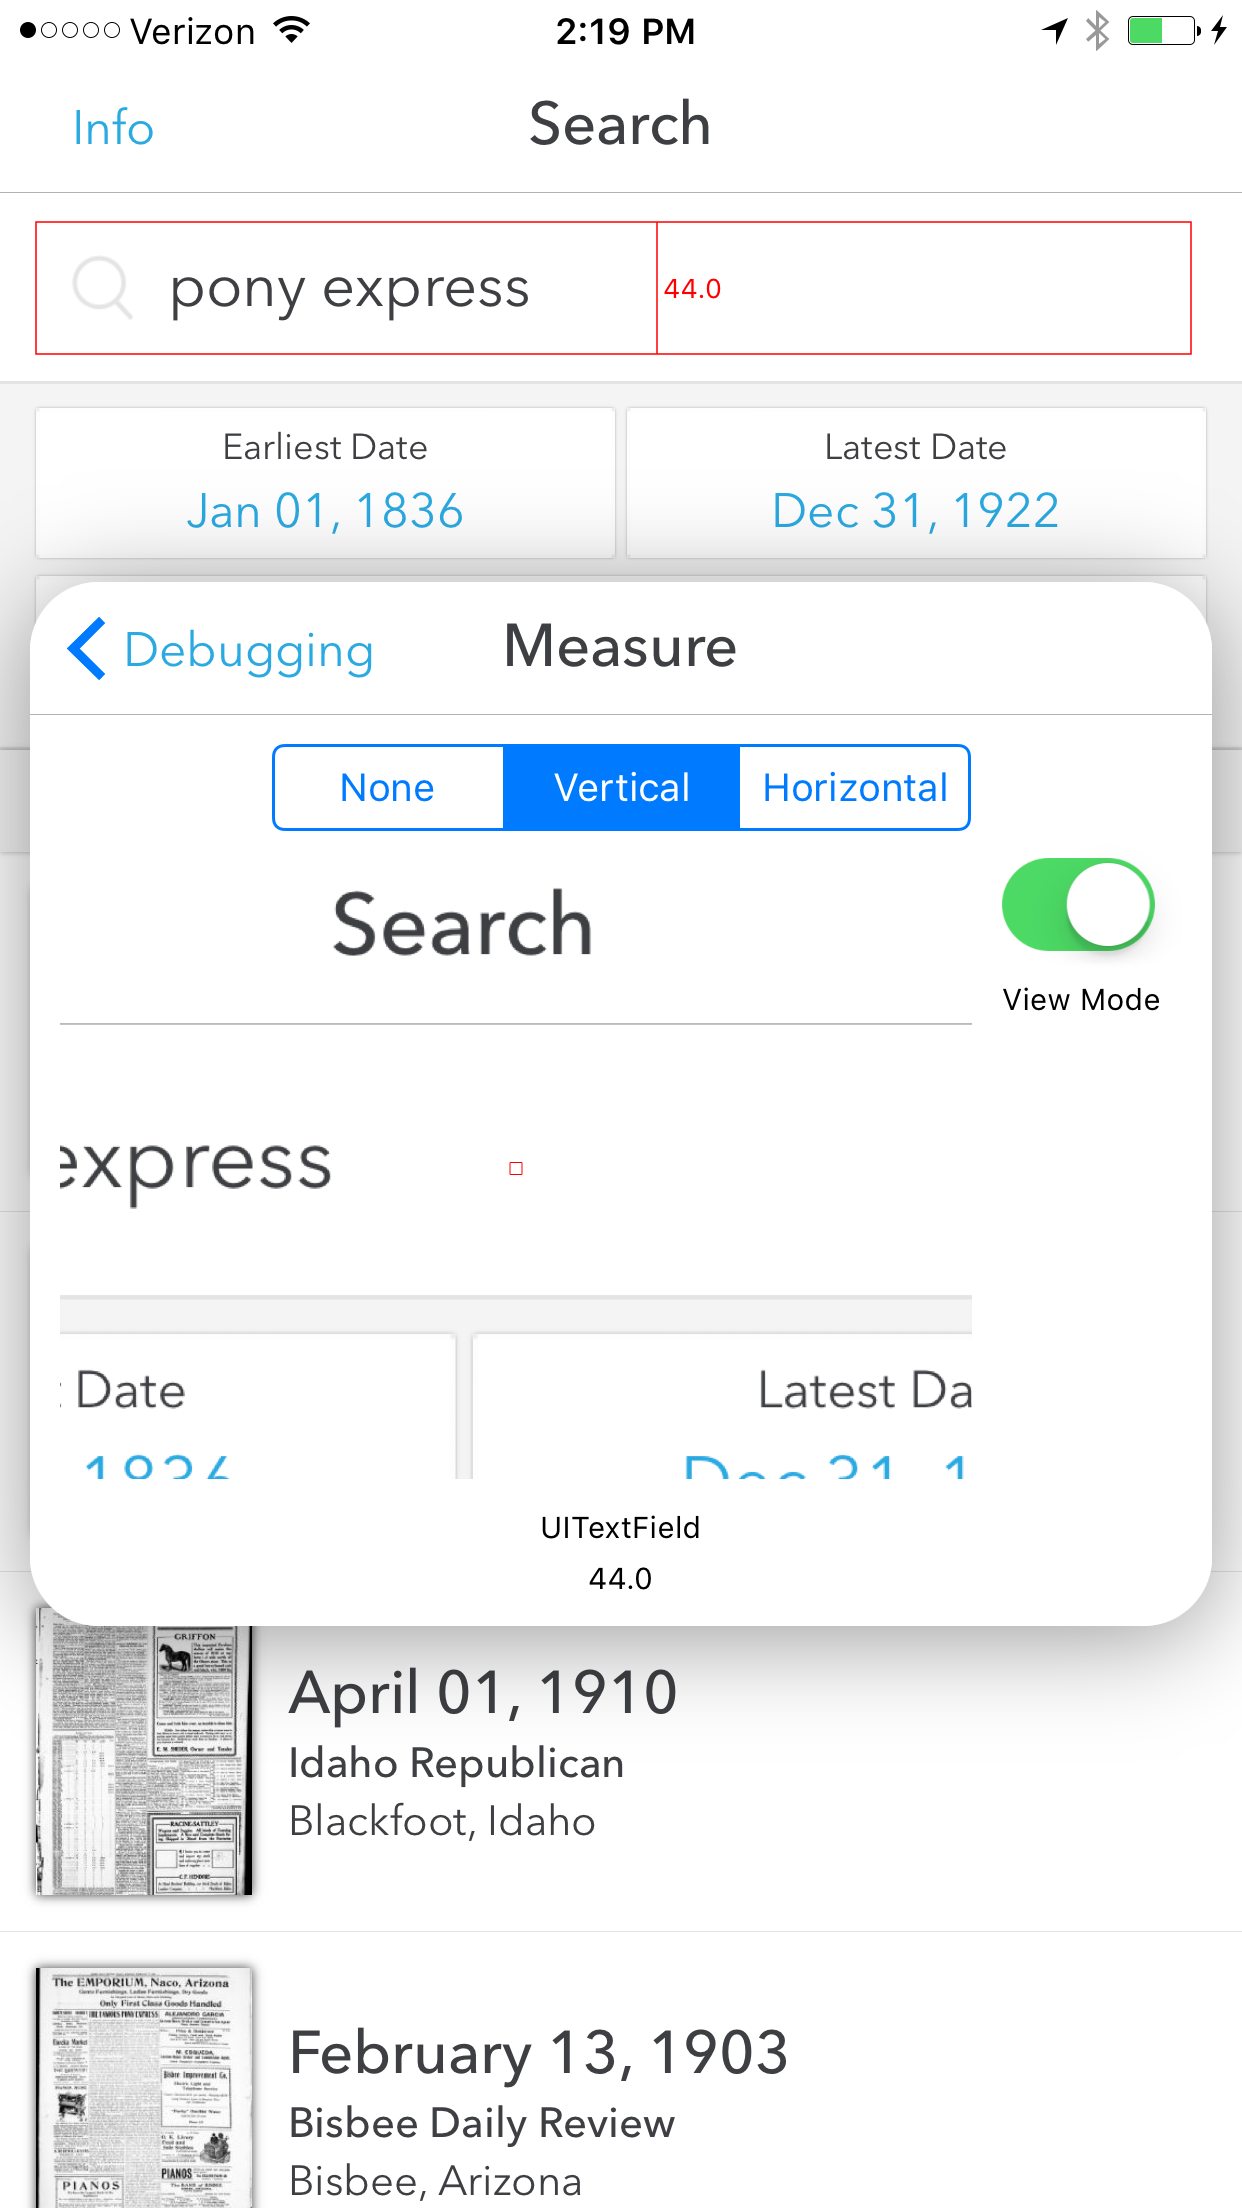
This is one of the cooler features of the overlay, in my opinion. It lets you measure dimensions (in points) of the screen’s elements. First, select whether you want to see measurements on the ‘Horizontal’ or ‘Vertical’ axis. Then drag your finger along the screen, using the magnified viewer inside the console to assist you. There are two modes:
The default mode ignores view boundaries. As far as I can tell, this mode treats the screen as a single rasterized image, and uses changes in color as boundaries for potential measurements. For example, in the screenshot below, I am able to measure the distance between the end of a label’s text and the edge of the screen:
“View mode”, on the other hand, displays the size of the subview in focus. Drag your finger over a view to see the selected axis’s dimension. In this screenshot, I’m measuring the height of the textfield at the top of the screen:
The 'Spec Compare' screen
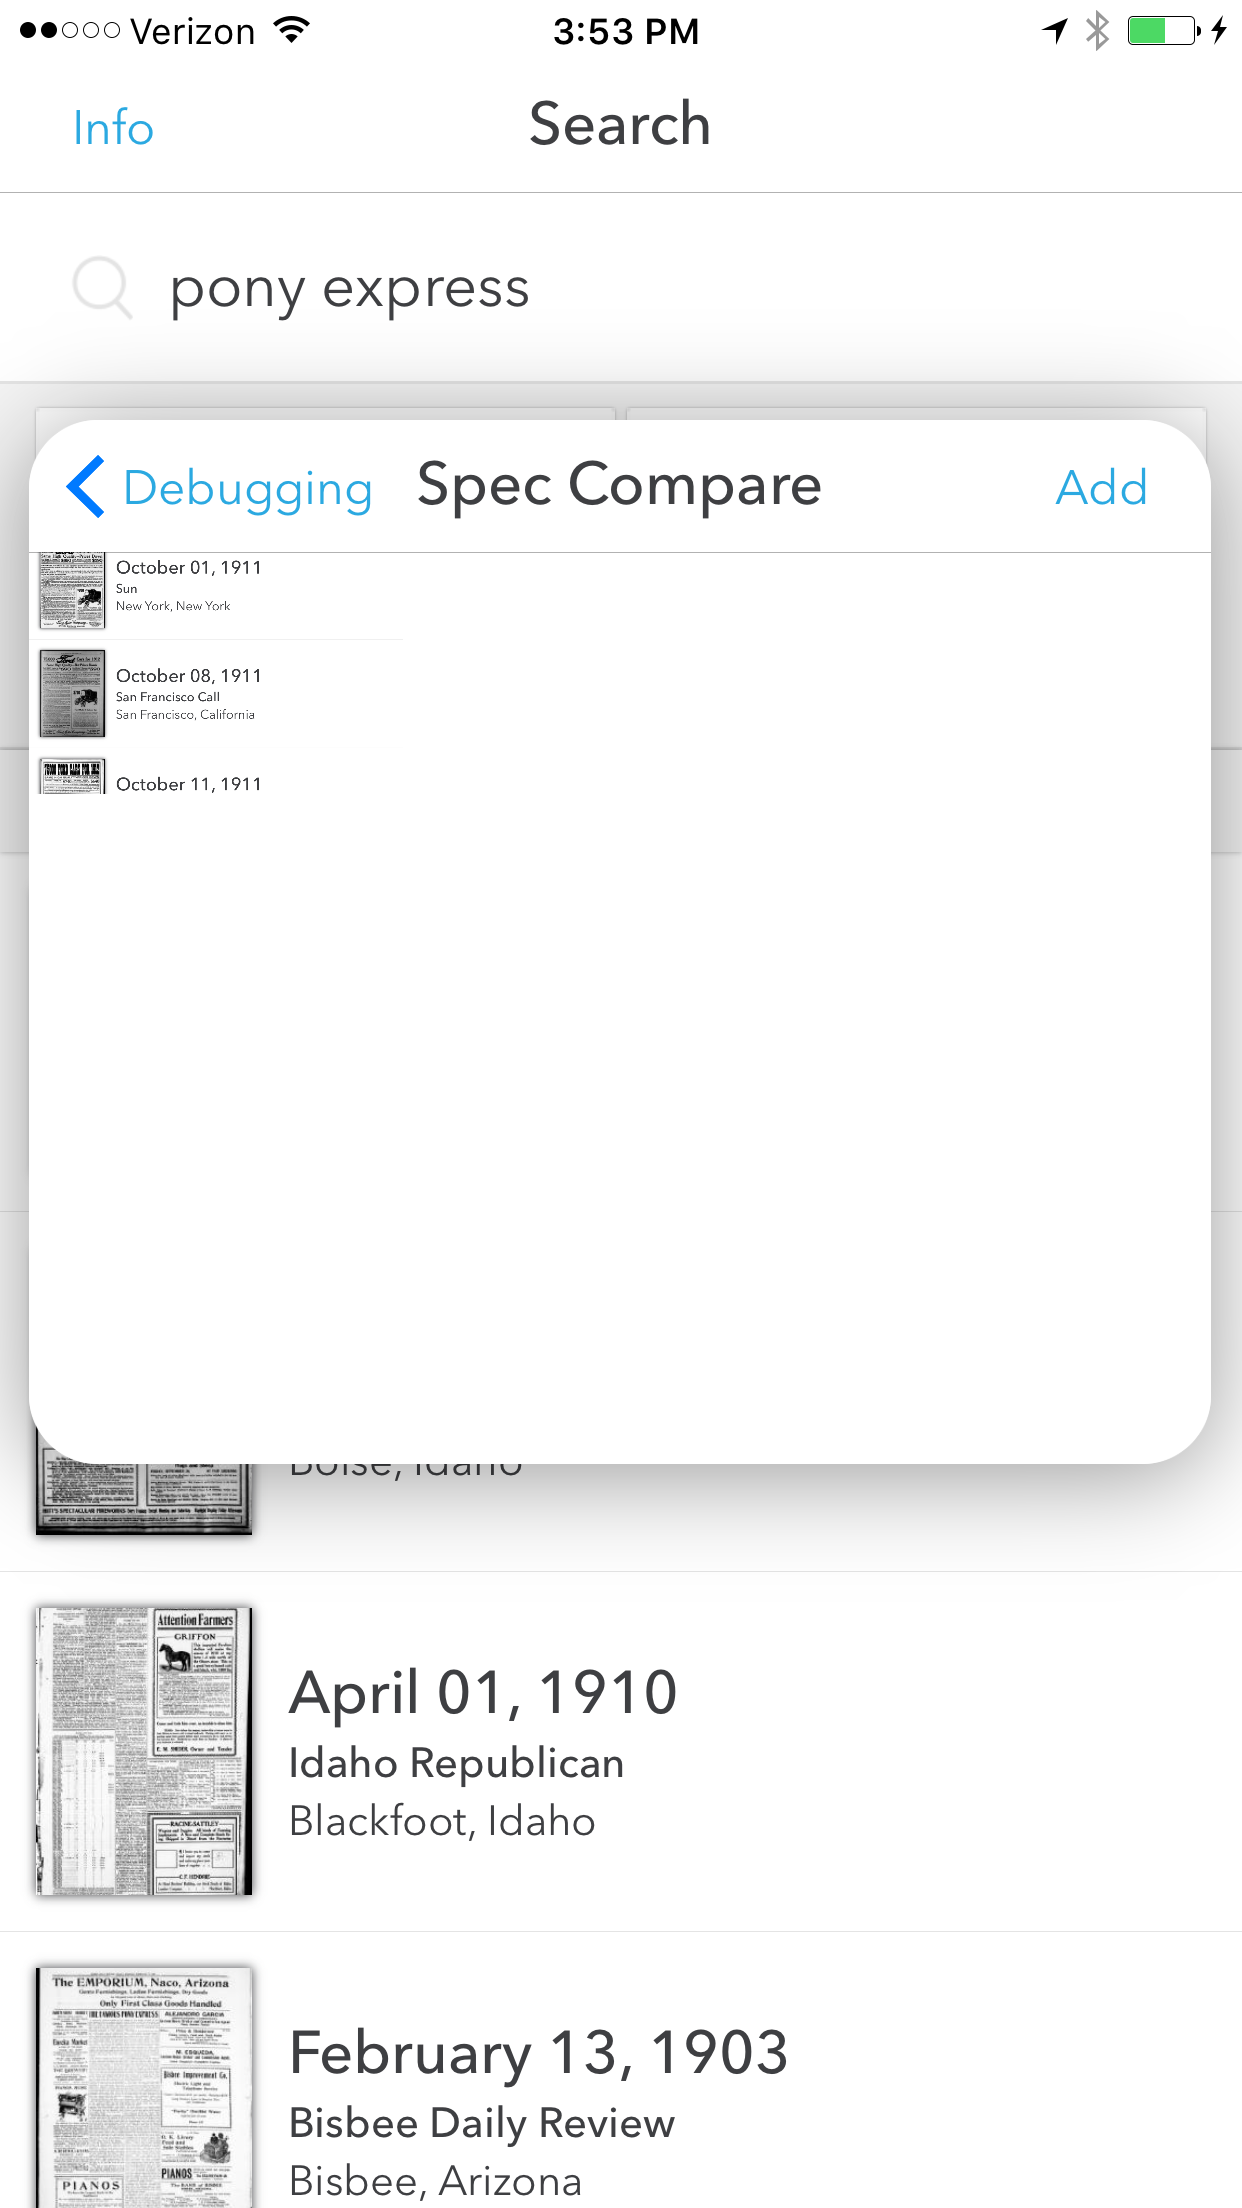
I could see this being an incredibly useful tool for collaboration between development and design. Add a screenshot to your device and then select it from the Spec Compare screen. The selected screenshot will be displayed on top of the live app. You can then drag down to decrease alpha and compare the spec to the actual implementation.
Update, May 26, 2017: Patrick Balestra reminded me that I left out an important step. You’ll need to include a value for the NSPhotoLibraryUsageDescription key in your Info.plist. Tapping the ‘Add’ button presents a UIImagePickerController, and doing so without setting this value will cause your app to crash.

Wrap-up
I’ve only had a few days to play with this thing but am hoping to put it to use in our next beta. The console has a few rough edges, but it seems like a promising alternative to many of the open-source tools out there. If you have a chance to use it and notice anything that I missed, please feel free to reach out. I’ll update the post as I learn more.